
In 2017, ZIP ran a promising trial in Remutaka Forest Park, which provided strong evidence that rivers are an effective barrier to possum migration.
But what about rats..?
We are currently carrying out a project in the Perth River valley to attempt to answer that very question.
The Perth River research area is bordered to the south and west by the Perth and Barlow Rivers – both fast flowing, rocky, glacial waterways that converge on the southern boundary of the research area.
Since April 2018 we have been bio-marking rats along a 3.2km stretch of the true left side of the Perth River, to enable us to identify whether any rats caught on the true right are likely to have crossed the river (see map below).
This project was designed to be carried out following the completion of a predator removal operation on the true right side of the river, which would provide a ‘clean’ side along which to measure rat crossing events. We had originally intended to complete the removal operation during winter 2018, but this has now been reprogrammed until early 2019.
We are now investigating a range of alternative methods to begin to assess the effectiveness of the Perth River as a barrier to rats, within the near future. The river is at its lowest flow during the winter months, so gaining an understanding of its effectiveness as a barrier at this time of year is important.
As to how we will measure that effectiveness – watch this space for an update soon!
In the meantime, some useful and interesting information has already been gathered from the river barrier project site. To date, we have been able to assess: (i) the relative abundance of rats immediately adjacent to the river on the true left side (to provide an indication of current rat ‘pressure’ on the river barrier), and (ii) whether enough rats will eat the bio-marker to provide robust data for this trial. These findings are outlined below.
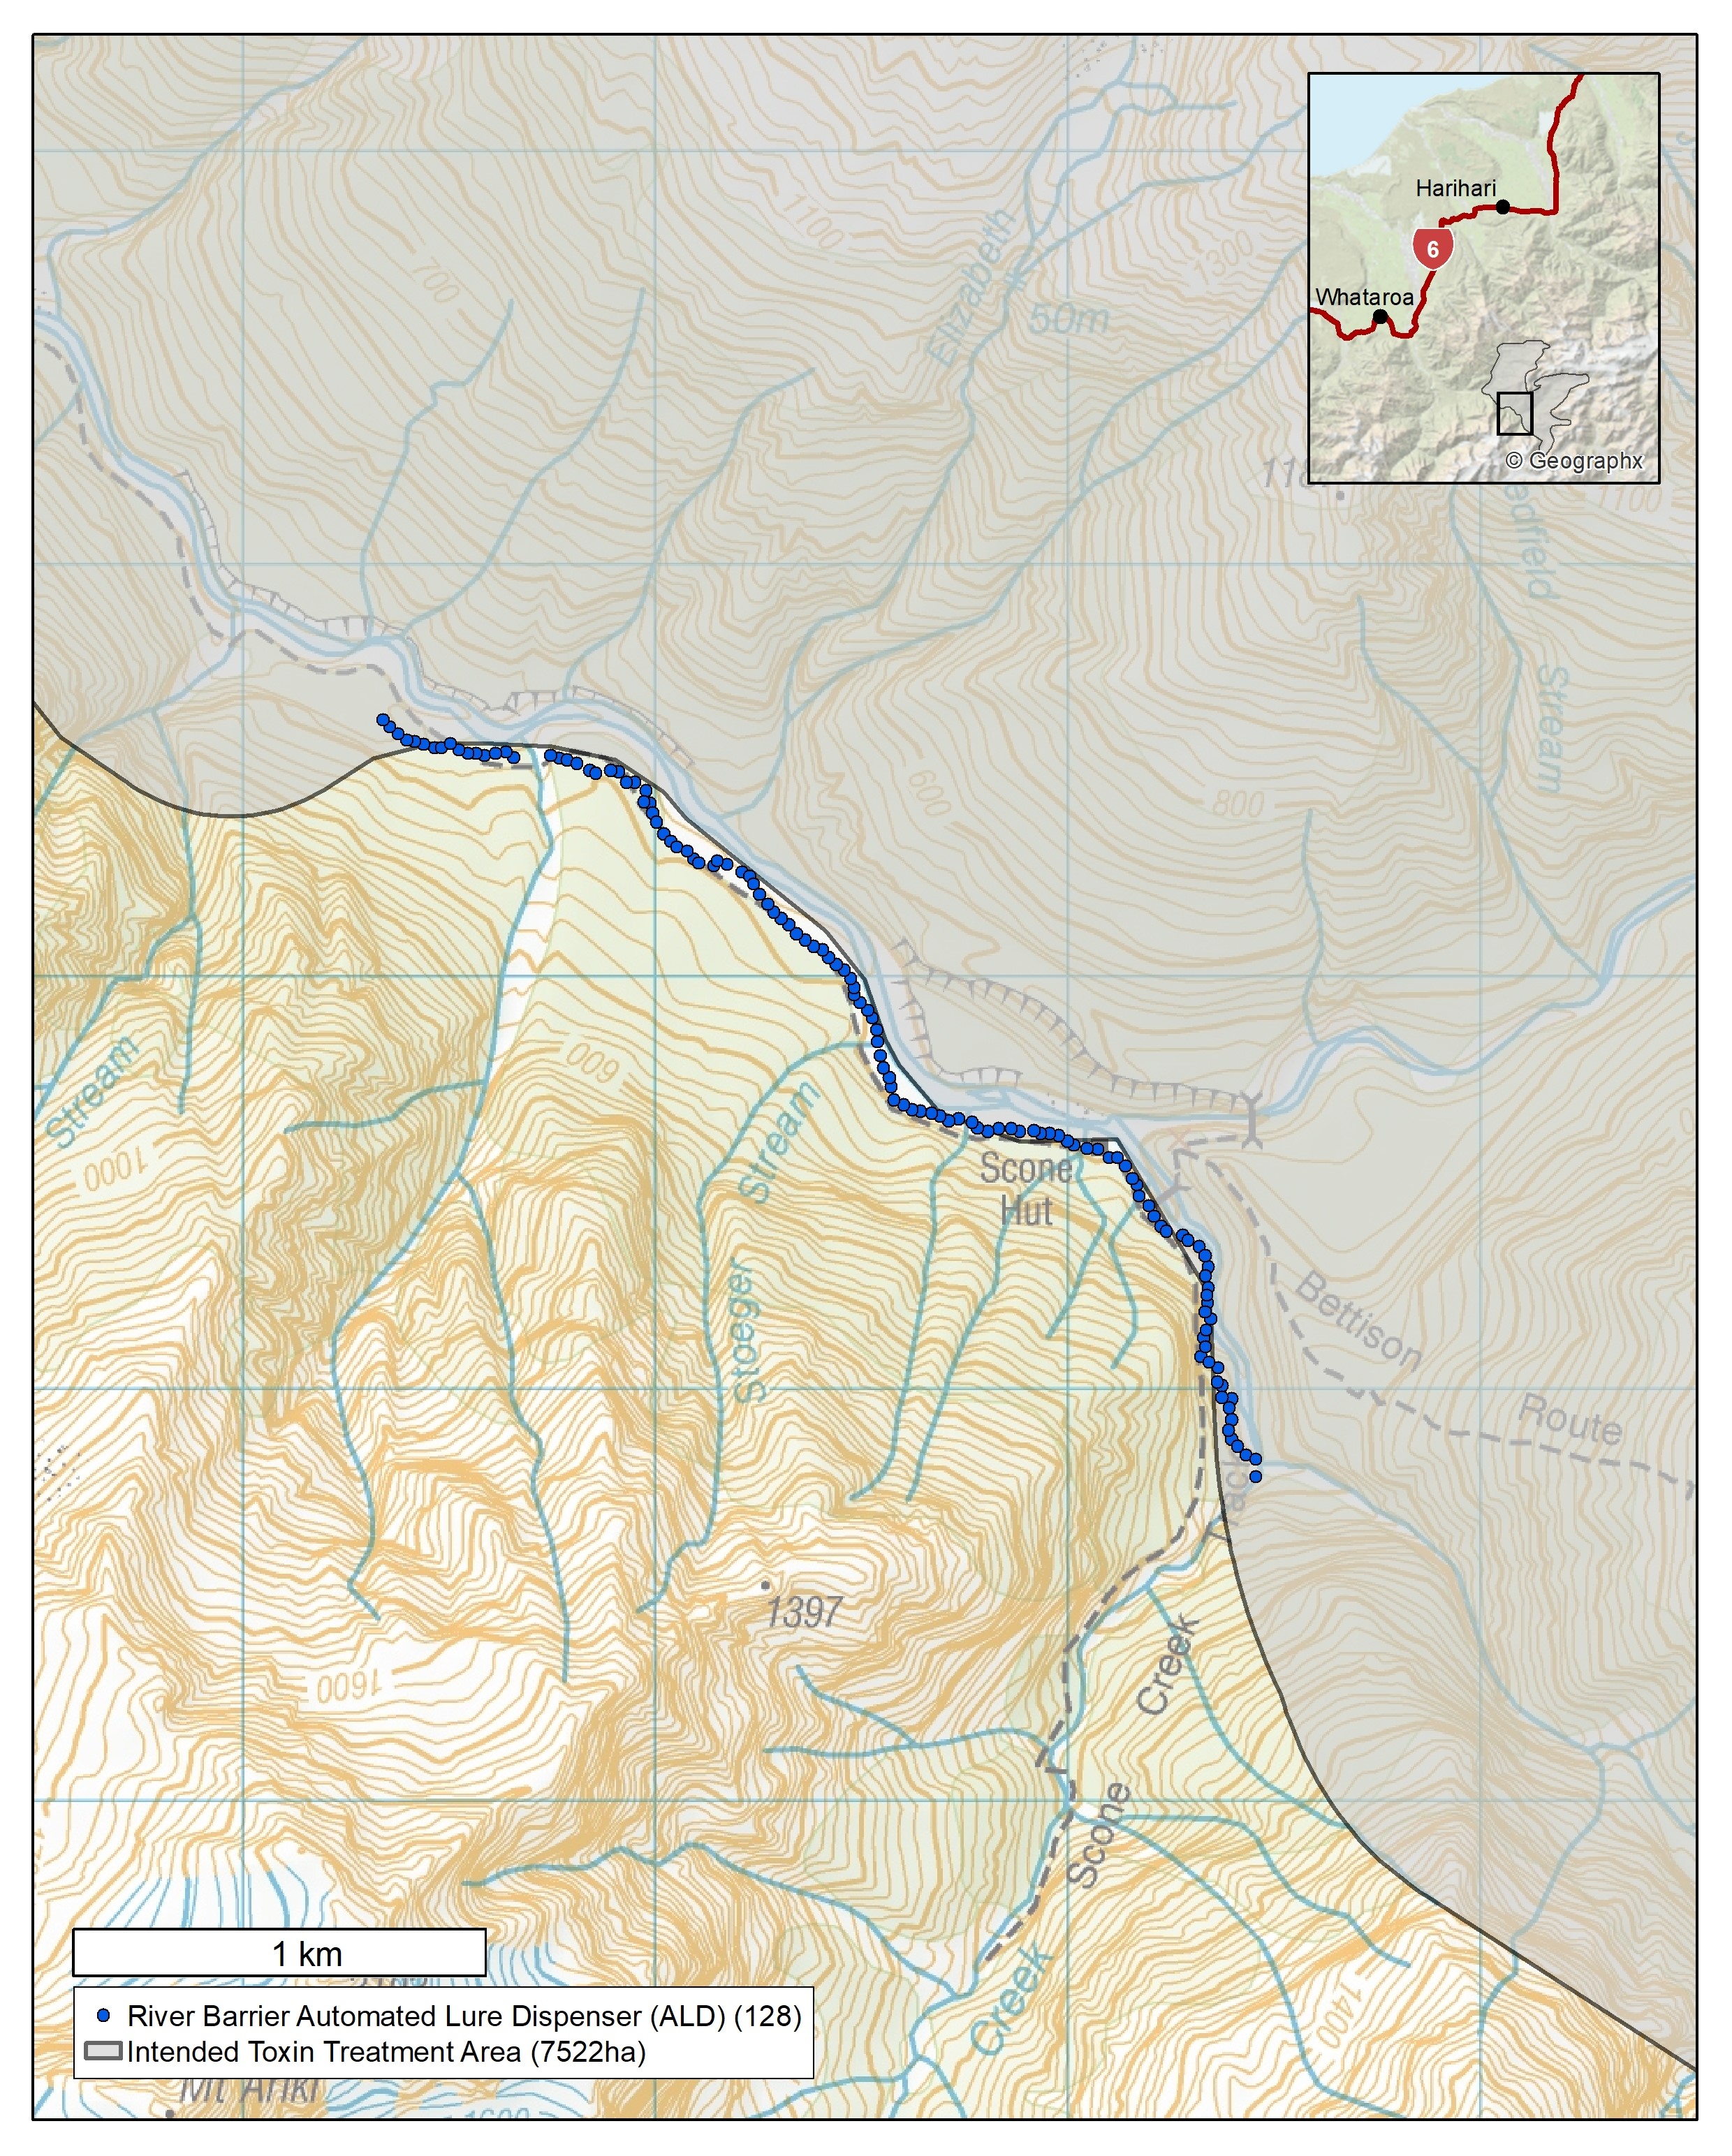
Map of river barrier assessment site, Perth River
Measuring rat pressure on the river
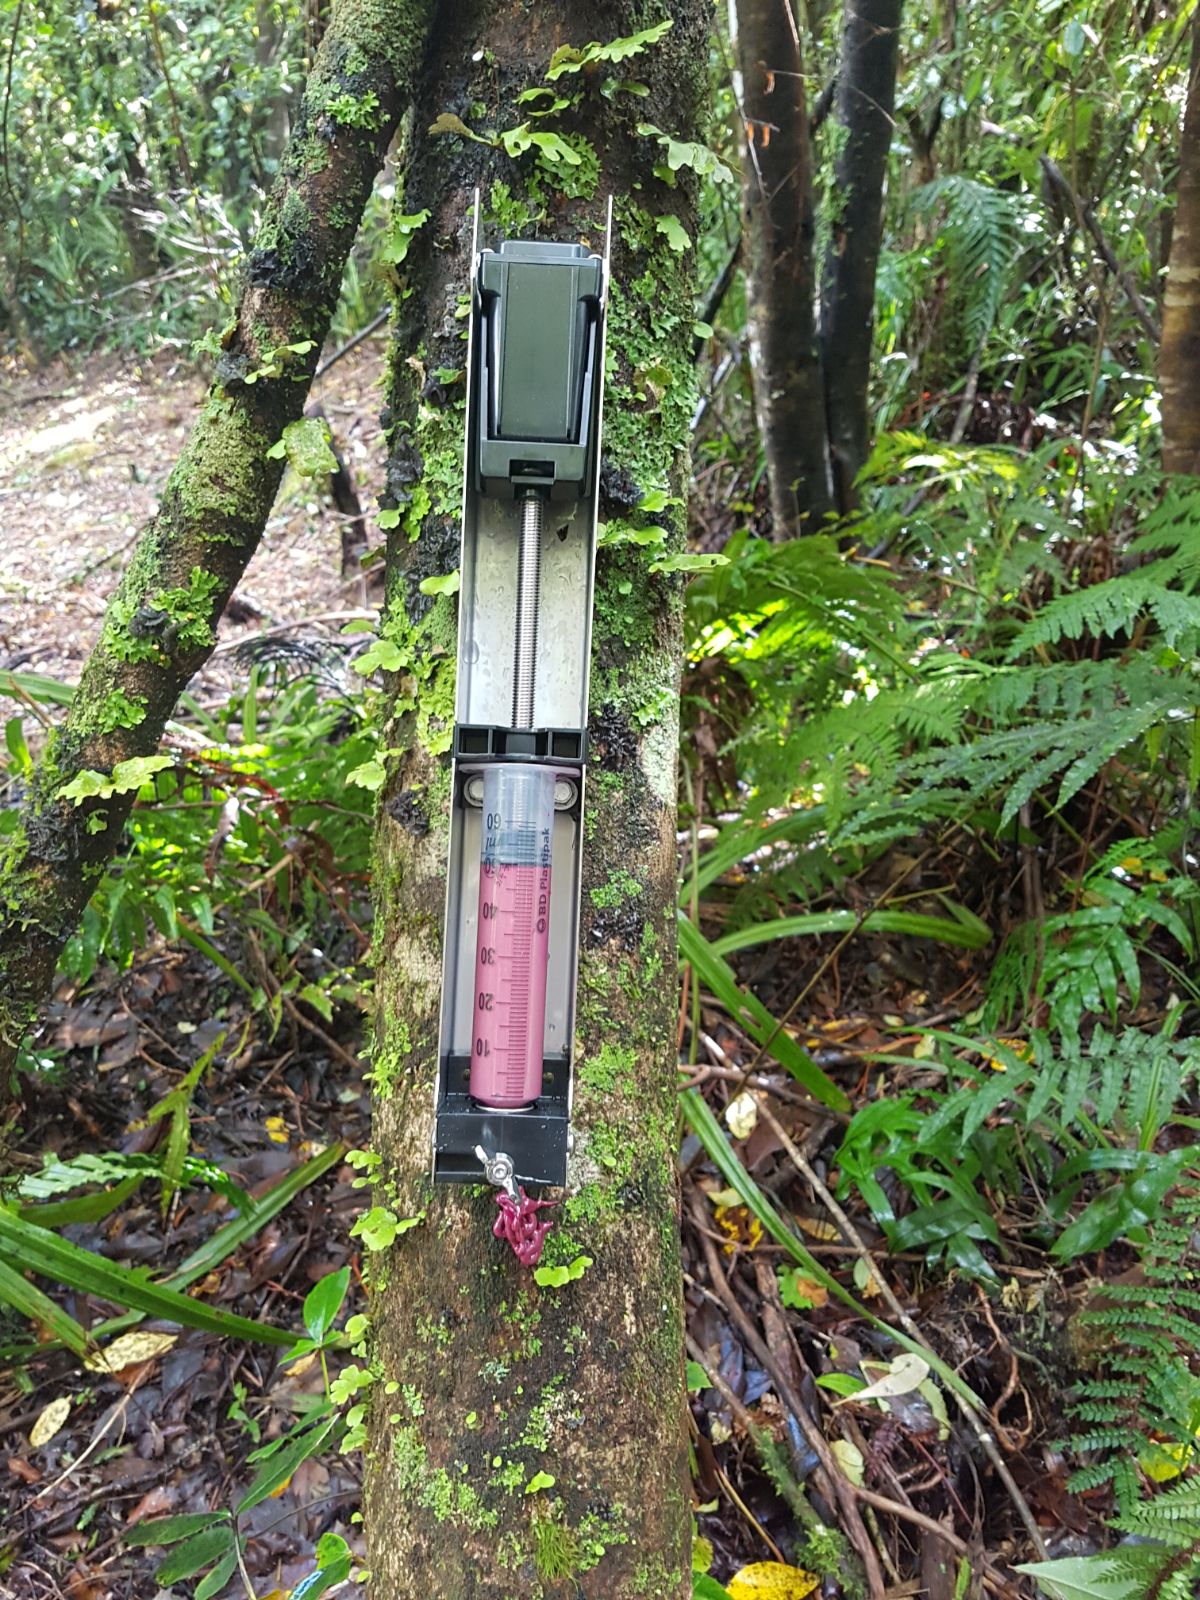
ZIP-developed automated lure dispenser containing Pics peanut butter laced with rhodamine B biomarker
ZIP-developed automated lure dispensers were installed on the true left side of a 3.2km stretch of the Perth River in the first week of April 2018. Every 24 hours, these dispensed Pics peanut butter laced with non-toxic rhodamine B bio-marker, which produces a fluorescent band visible under microscope in the growing whiskers of rats after they have eaten it. These were left in place to ‘feed’ rats for a month before measuring rat relative abundance in the same area.
Rat relative abundance is a measure used in predator control to estimate the relative number of rats within an area. This measure, in turn, provides us with an indication of the invasion ‘pressure’ on the river.
Relative abundance was measured over three fine nights along the same stretch of river where the automated lure dispensers were installed. A total of 53 Victor Professional rat kill traps were deployed at 50m spacing, lured with Pics peanut butter, in single entry black corflute tunnels. Results were calculated as the mean number of rats caught per 100 corrected trap nights (C100TN).
A total of 41 rats were caught over the three nights. After accounting for sprung traps, we determined a relative abundance of 39.4 rats/C100TN.
This is a relatively high score and may well be influenced by pre-feeding with Pics peanut butter (via the automated lure dispensers) for a month before trapping. If true, this pre-feeding principle may have wider application in trapping operations, including the Remove and Protect model. If invaders can be cued onto a lure before they invade, they may then be significantly more likely to be trapped using that same lure.
As for the river barrier assessment project, we now have confidence that there are plenty of rats present in the research area, and therefore the ‘rivers as a barrier’ concept remains a real test.
Uptake of the bio-marker by rats
The rat relative abundance survey also enabled us to determine the proportion of rats that were eating from the automated lure dispensers, by looking for evidence of the biomarker in the trapped rats. Whisker samples were taken from 37 of the 41 rats caught, and an additional two rats caught at Scone Hut during the same time period. We analysed those whisker samples under a microscope at Lincoln University, looking for the bright, solid bands of fluorescence from the rhodamine B. If three or more whiskers were found to show traces of rhodamine B, the rat was deemed to have fed on the prefeed from the automated lure dispenser.
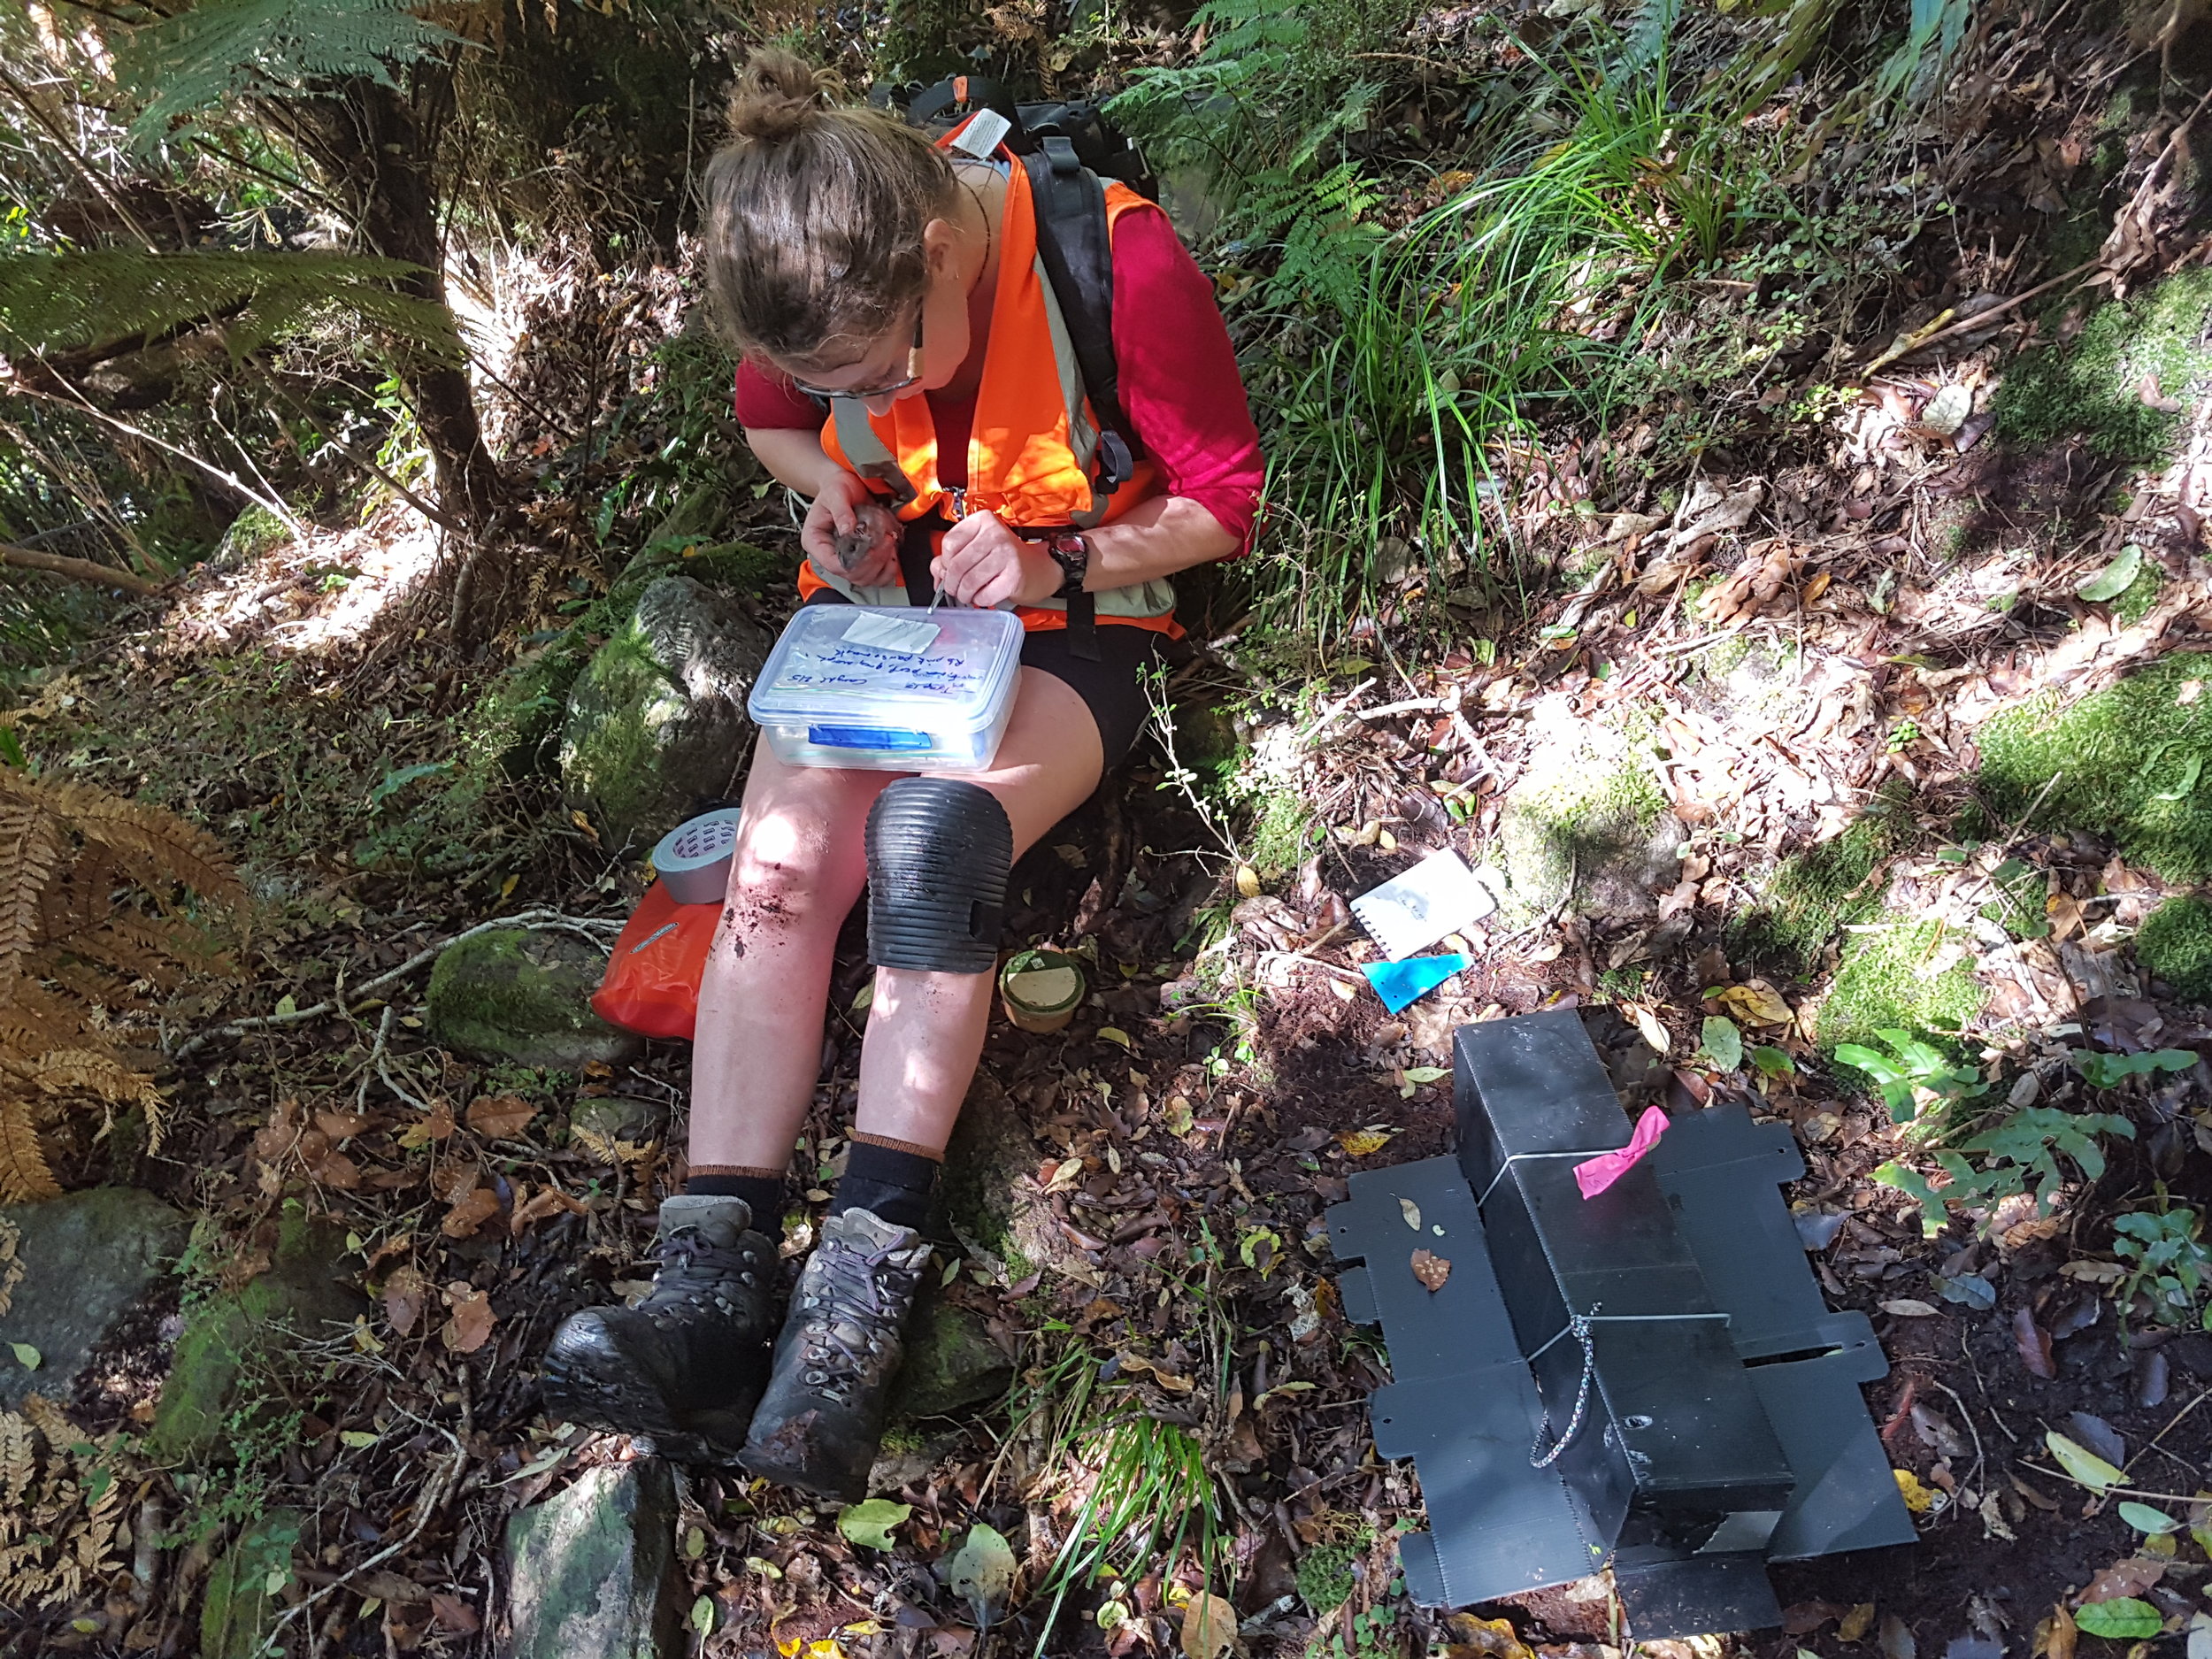
Taking whisker samples for analysis

A ship rat showing visible rhodamine B traces in belly fur
A total of 82% (32/39) of rats caught and analysed were found with traces of rhodamine B, meaning this proportion of the resident population (as a minimum) had been feeding from the automated lure dispensers. This is a very encouraging result for the rat river barrier assessment, especially considering that uptake of the bio-marked lure is likely to increase the longer the automated lure dispensers are in place.
Ensuring a high proportion of marked rats is important as it gives us the best opportunity to determine whether any rats caught on the true right side of the river have braved the icy waters to get there.