Background
Preparations continue for implementation of our ‘1080 to Zero’ operation in the Perth River Valley, South Westland. The objective of this operation is to completely remove possums (and potentially ship rats). The operation is also expected to have a substantial effect on the local stoat population; however, to what extent remains unknown. In order to evaluate the success (or otherwise) of our operation, we need to have an understanding of relative abundance of these target species in the site pre-operation. So, at the end of March and early April, we undertook to measure the relative abundance of possums, rats, and stoats within our project area.
We also took the opportunity to measure the presence of non-target species within the area, in order to estimate whether these species are affected by the aerial operation.
Measuring predator relative abundance
The Perth River Valley site consists of 12,000ha of mountainous terrain, surrounded by substantial rivers and glaciers, up to 3,250m in elevation at some locations. An area of approximately 7,500ha within this site will be aerially treated with 1080.
Within this area a total of 12 monitoring lines were deployed, each 500m in length and positioned evenly across different vegetation types and elevations, between 290 and 1,600m. Lines were widely spaced, to ensure individual animals were unlikely to encounter devices from multiple lines.
We followed the National Pest Control Agency (NPCA) standard guidelines for monitoring possums and mustelids (in this case, stoats and weasels), and DOC standard protocol for rats.
Tracking tunnels were placed along lines at 50m intervals for rats. Tunnels were placed at 100m intervals for stoats, accompanied by motion-sensing cameras (positioned over tracking tunnels). WaxTags™ were used for possums, deployed at 20m intervals along a 200m stretch of each line. Each monitoring line ran for 7 days. Rats were tracked on the first day, followed by three days of camera trapping and tracking for stoats. The full 7 days were used to monitor possums.
Measuring the non-target species
The same camera traps used to monitor stoats were also used to monitor the activity of various non-target species within the site. We deployed these cameras three weeks prior to the one-week abundance index surveying of target species. Cameras were not lured during this time; however, because many species prefer to follow cut tracks, the cameras were well placed to capture a variety of species.
Relative predator abundance results
In total, 59 out of 60 camera traps remained functional throughout the pre-operation target and non-target species surveys. Using the standard protocol for each target species, our results were:
48% possum chew across site (58/120 WaxTags),
12.5% tracking of rats across site (15/120 tracking tunnels), and
1.7% stoat tracking across site (1/60 tracking tunnels).
Stoat exiting tracking tunnel, 18 April 2018
Camera traps were used to increase confidence in results for stoats, as recent literature suggests they have a much higher sensitivity for these species than other available detection tools. However, over the course of the three-day survey for stoats, both camera trap and tracking tunnel results were the same.
Comparing the industry standard with camera detections
Camera traps used during the non-target species survey period were left running during the one-night tracking tunnel index for rats. When comparing only the 60 tracking tunnels paired with camera traps during this time, a total of 10 cameras across the site detected rats (16.7%), compared with only 6 tracking tunnel detections (10%). This result, although a seemingly small difference, shows once again the sensitivity of camera traps, even for smaller species such as rats.
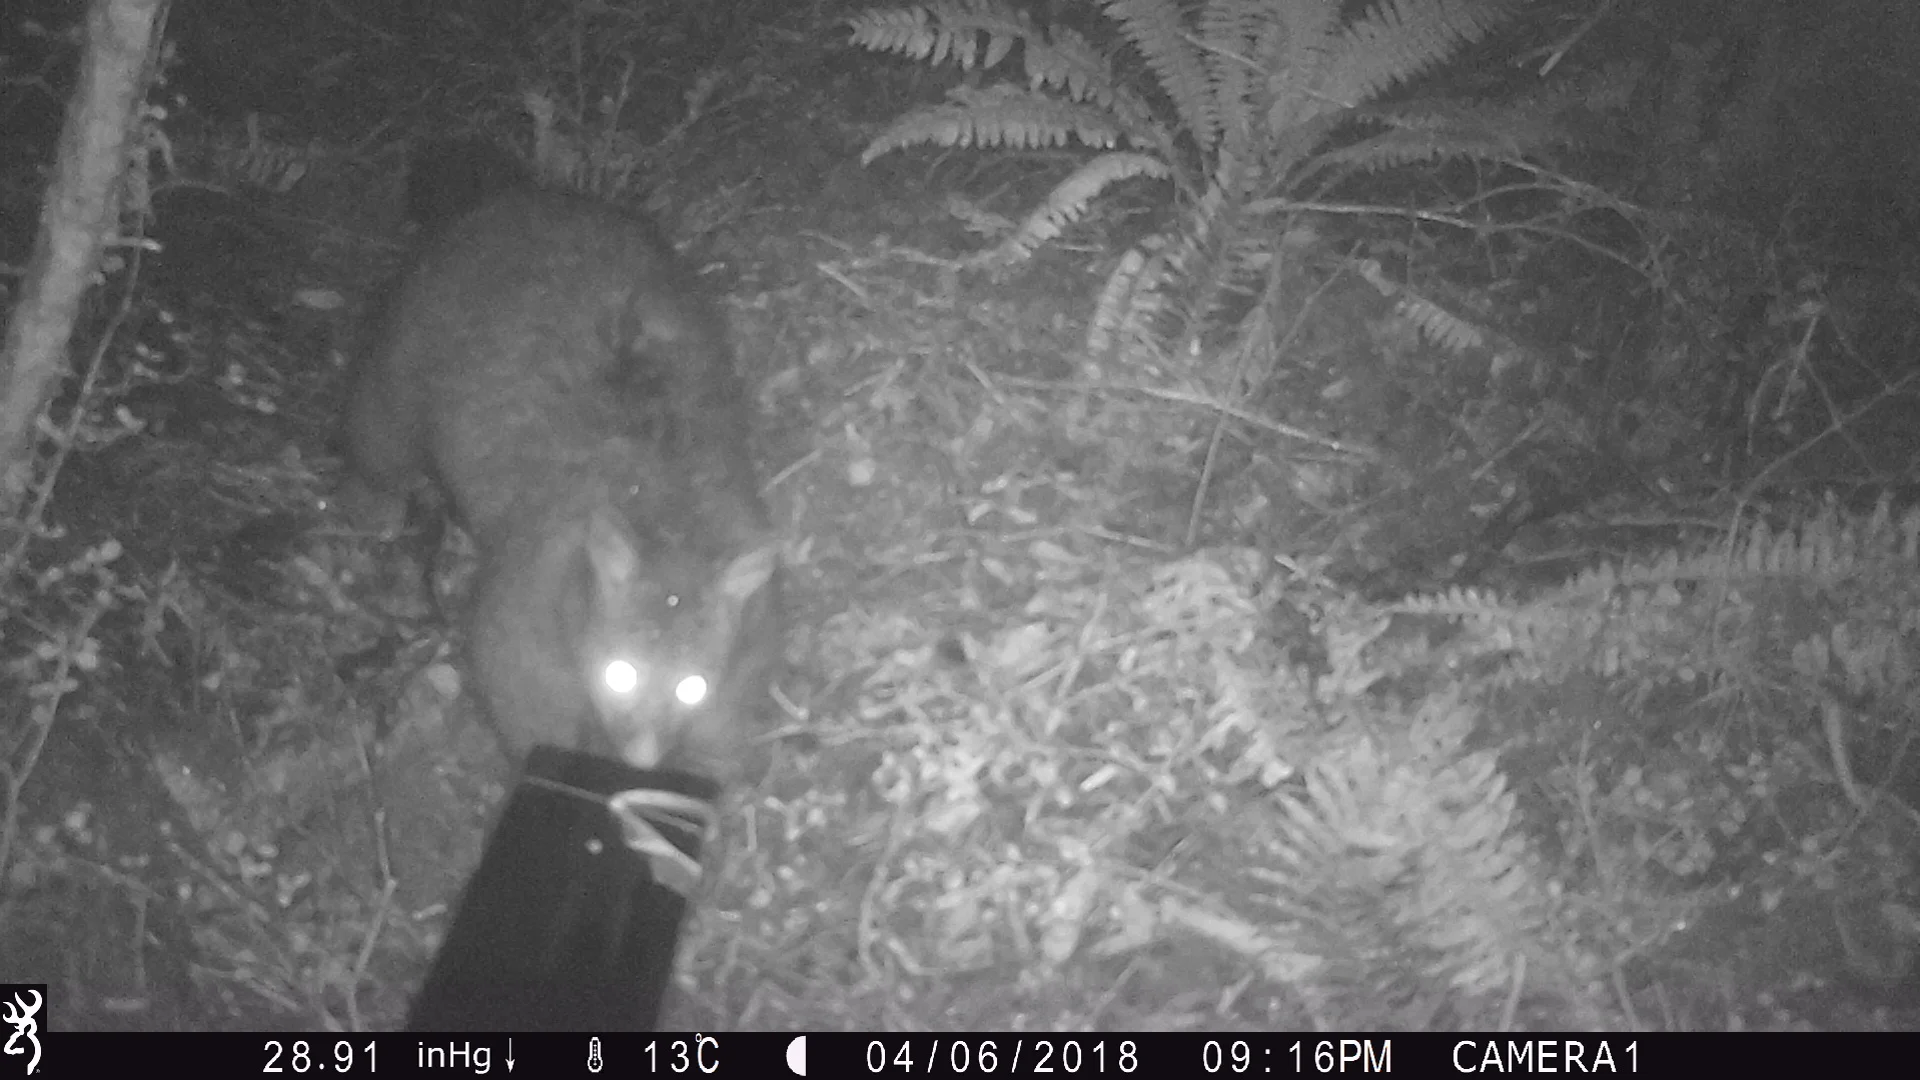
We also observed numerous rat encounters over the course of the three-week non-target species camera survey (Table 1). Many recent studies have suggested that the length of time for device deployment is highly influential on the probability that it will detect an animal. For instance, looking only at the three days prior to the standard one-night tracking index for rats, a total of 17 cameras detected rats. Over the course of the three weeks in total, 29 out of the 60 cameras detected rats; stoats were detected on 11 cameras, and possums were detected on 37 cameras (Table 1).
Table 1 Standard index monitoring and camera trapping results
Non-target species seen on our camera network
During the three weeks of pre-operation camera trapping, we found chamois (on 7 cameras), deer (6), Kea (2), Tomtits (3), South Island robins (7), black birds (5), and a weasel (1) on camera.
South Island robin, 24 April 2018
Chamois, 24 April 2018


